
ICESat-2 maps Antarctic surface-height change, 2019–2021
NASA source video. Playback starts muted; use the player controls to enable sound.
NASA's Antarctic overview visualizes measured surface-height changes from April 2019 to July 2021. Red and blue indicate lowering and rising relative to the reference surface; the graphic includes the satellite's polar latitude limit.
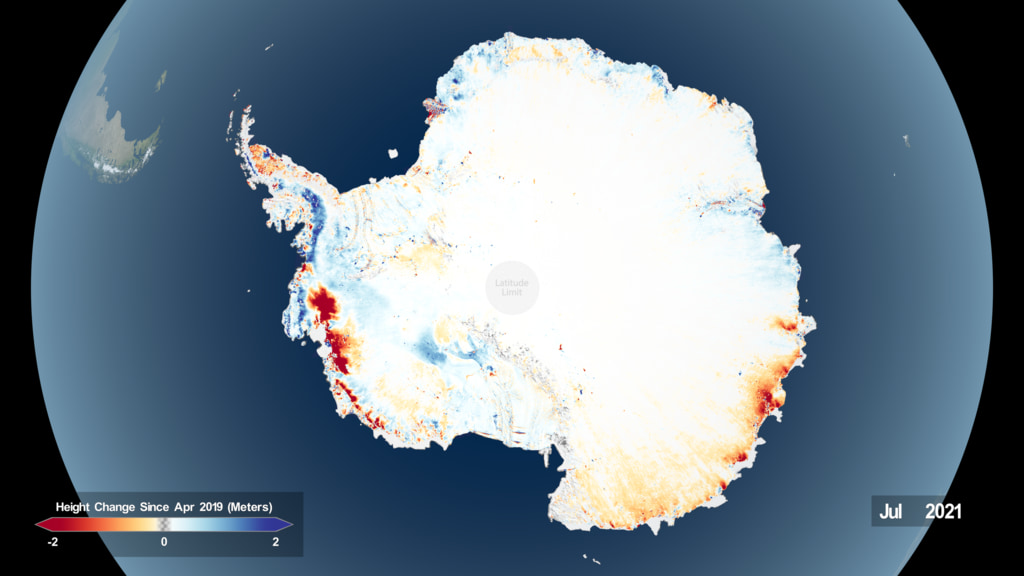
NASA Scientific Visualization Studio; visualization by Kel Elkins; produced by Ryan Fitzgibbons.
NASA informational and educational media guidelines; agency credit retained and no endorsement implied. No item-specific third-party restriction observed for this selected animation.
Scope and limitations
This is a scientific visualization, not aerial film. Height change alone is not identical to ice-mass change; snowfall and ice dynamics can both affect surface elevation. This dated version has a newer successor linked on the original NASA page.